Transforming Real Estate Operations with Tableau Dashboards
Supercharge your real estate business with a tailored real estate data analytics solution.

Industry
Real Estate
Business Functions
Operations
Solutions Delivered
Real Estate Operations with Tableau Dashboards
Technologies
Tableau
Geography
India
About the Customer
Our client is a prominent real estate company specializing in residential and commercial properties. To streamline its operations and enhance decision-making, client embarked on a transformative journey to create Tableau dashboards catering to various departments, including Sales, Marketing, Plant Project Management, Finance, and CXOs. This case study highlights the successful implementation of Tableau dashboards across these departments and the resulting improvements in data-driven decision-making.
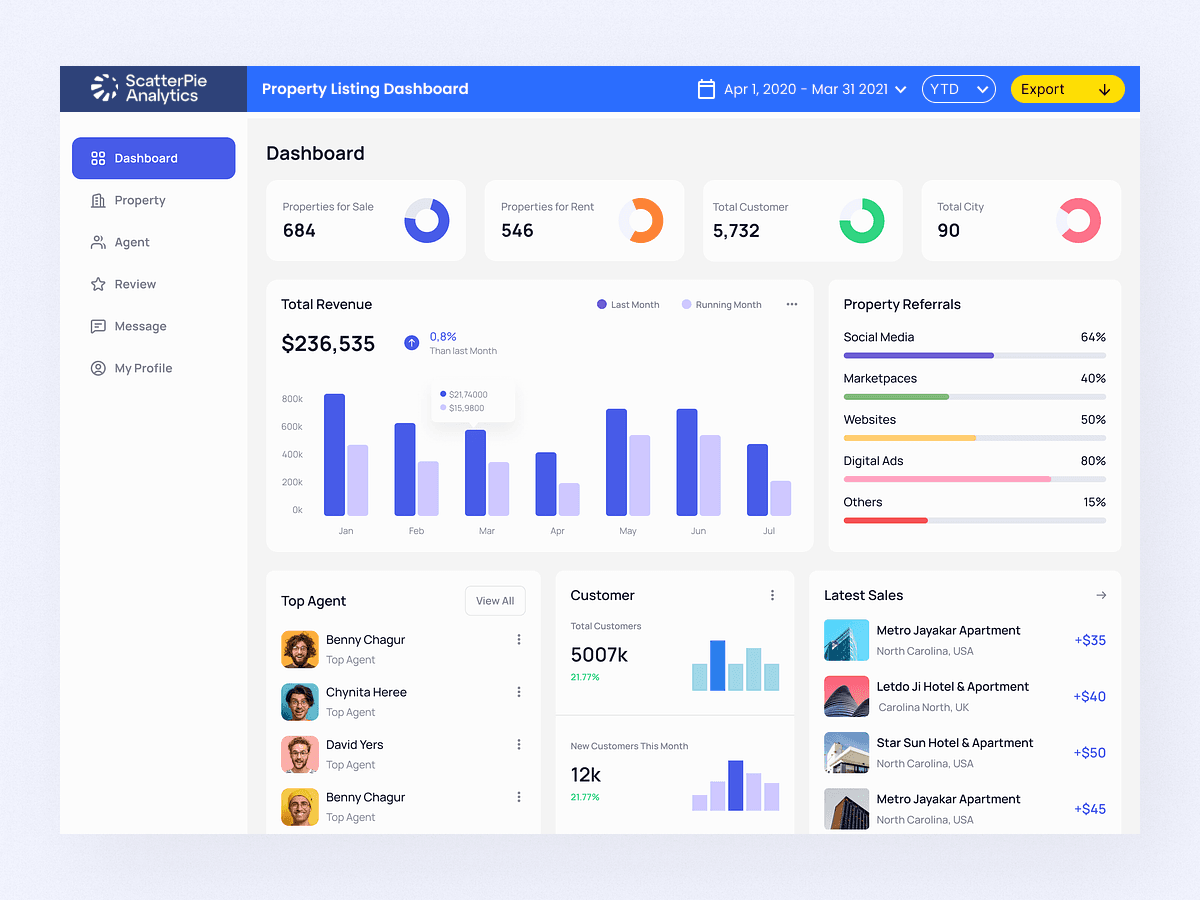
Sample Dashboard
Major Data Challenges Our Client Faced
- Data Fragmentation: ABC Realty faced challenges in consolidating data from various sources, resulting in fragmented information and slow decision-making processes.
- Lack of Visibility: The absence of real-time visibility into sales, marketing campaigns, project statuses, and financial performance hindered the company’s ability to respond to market dynamics effectively.
- Manual Reporting: The reliance on manual reporting processes led to inefficiencies, delayed insights, and increased potential for errors.
ScatterPie’s Objective in Resolving These Challenges
Our mission was to provide advanced data analytics solutions to address these challenges and enable data-led decision-making for the real estate professionals.
- Seamless Data Integration: Create a unified and centralized data repository by integrating data from various sources and breaking down data silos.
- Real-Time Insights: Develop real-time dashboards to provide key stakeholders with instant insights, enabling prompt decision-making and enhanced agility.
- Predictive Maintenance Excellence: Leverage AI and ML techniques to develop accurate predictive maintenance models, reducing unplanned downtime and optimizing maintenance schedules.
- Advanced Quality Analytics: Implement advanced analytics to identify quality patterns and ensure consistent top-notch product quality, reinforcing the client & reputation for excellence.
ScatterPie’s Solution
The client undertook the development of Tableau dashboards tailored to the specific needs of different departments:
- Sales Dashboard: The Sales team’s dashboard provided real-time insights into property listings, sales progress, agent performance, and customer interactions. Key performance indicators (KPIs) included sales volume, conversion rates, and customer feedback.
- Marketing Dashboard: The Marketing team utilized the dashboard to track the performance of marketing campaigns, website traffic, social media engagement, and lead generation. The dashboard facilitated campaign optimization and resource allocation based on data-driven insights.
- Plant Project Management Dashboard: For the Project Management department, Tableau dashboards displayed project timelines, budget vs. actual spending, resource allocation, and project status updates. This allowed project managers to identify bottlenecks and allocate resources efficiently.
- Finance Dashboard: The Finance department leveraged the dashboard to monitor financial performance, budget adherence, revenue projections, and expense trends. Users could drill down into detailed financial data for in-depth analysis.
- CXO Dashboards: Customized dashboards for the CXOs provided a holistic view of the company’s performance. These dashboards aggregated data from all departments, offering executives insights into overall operations, financial health, and strategic decision support.
Key Features and Benefits:
- Real-time Insights: Tableau dashboards provided real-time access to critical data, empowering teams to make informed decisions promptly.
- Data Integration: By integrating data from disparate sources, client achieved a unified view of operations across departments.
- Interactive Visualizations: Dashboards featured interactive visualizations, enabling users to explore data and uncover trends intuitively.
- Automated Reporting: The automation of reporting processes reduced manual effort and improved accuracy.
- Cross-Departmental Collaboration: The dashboards facilitated collaboration and knowledge sharing among different departments, promoting a more data-driven culture.
The Impact of Our Solution
The implementation of Tableau dashboards across Sales, Marketing, Plant Project Management, Finance, and CXOs yielded significant results:
- Sales Growth: The Sales team achieved a 20% increase in sales volume through better lead management and agent performance tracking.
- Marketing ROI: Marketing campaigns became more targeted and effective, resulting in a 15% increase in ROI.
- Project Efficiency: The Project Management department improved project delivery times by 25% and enhanced resource allocation accuracy.
- Financial Stability: The Finance department achieved better control over expenses, resulting in a 10% increase in profit margins.
- Executive Decision-Making: CXOs gained a comprehensive view of the company’s operations, enabling strategic decisions that led to a 30% growth in revenue.
The Client successfully transformed its real estate operations by implementing Tableau dashboards tailored to the specific needs of Sales, Marketing, Plant Project Management, Finance, and CXOs. This data-driven approach led to improved sales, marketing efficiency, project management, financial stability, and executive decision-making. By harnessing the power of Tableau’s visualization and analytics capabilities.