Effective Finance Data Analysis
We redesigned the finance data management & analysis for a large manufacturing company to analyze the financial details effectively

Industry
Manufacturing, Retail, E-commerce, Supply Chain
Business Functions
Sales, Finance, Inventory
Solution Delivered
Data Analytics, Dashboard Development
Technologies
Tableau, Power BI
Geography
India
Our Client
Our client is one of the largest manufacturing companies in India.
Its critical challenges were to keep the track of the following factors accurately & promptly:
- Total current outstandings
- Overdue receivables inventory margins assets Liabilities
What Was The Major Challenge?
A CFO dashboard needs to integrate data from multiple systems to give a complete picture of an organization’s performance. Capturing real-time data from multiple sources and handing it in excel to create reports for analysis is a time-consuming and tedious process and requires multiple resources to complete the task.
Any ad-hoc report requests increased the turnaround time hence impacted on the decision-making process. As the finance data is changing frequently, it became difficult to track actual business stars through excel for accurate decision-making. Ultimately, decision-makers were left with boring tables and complex calculations.
What Were Our Objectives?
Our primary goal was to step away from dull, unclear, and messy data excels and make the analytics eye-pleasing and intuitive.
The secondary goal was to provide a list of KPIs that can be tracked additionally to make the decision-making process better & faster.
How We Helped Our Clients Effectively Manage The Cash Flows
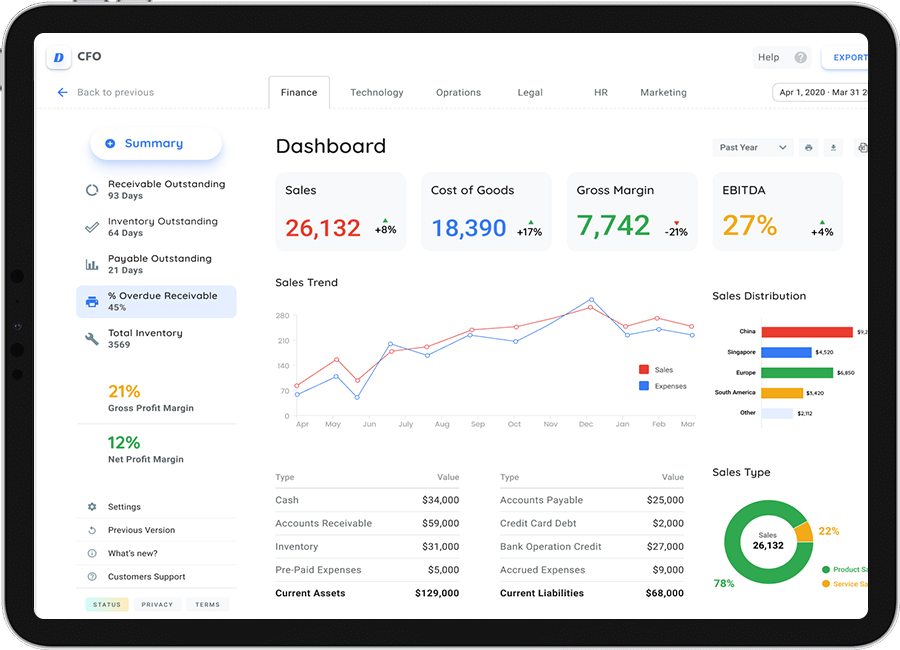
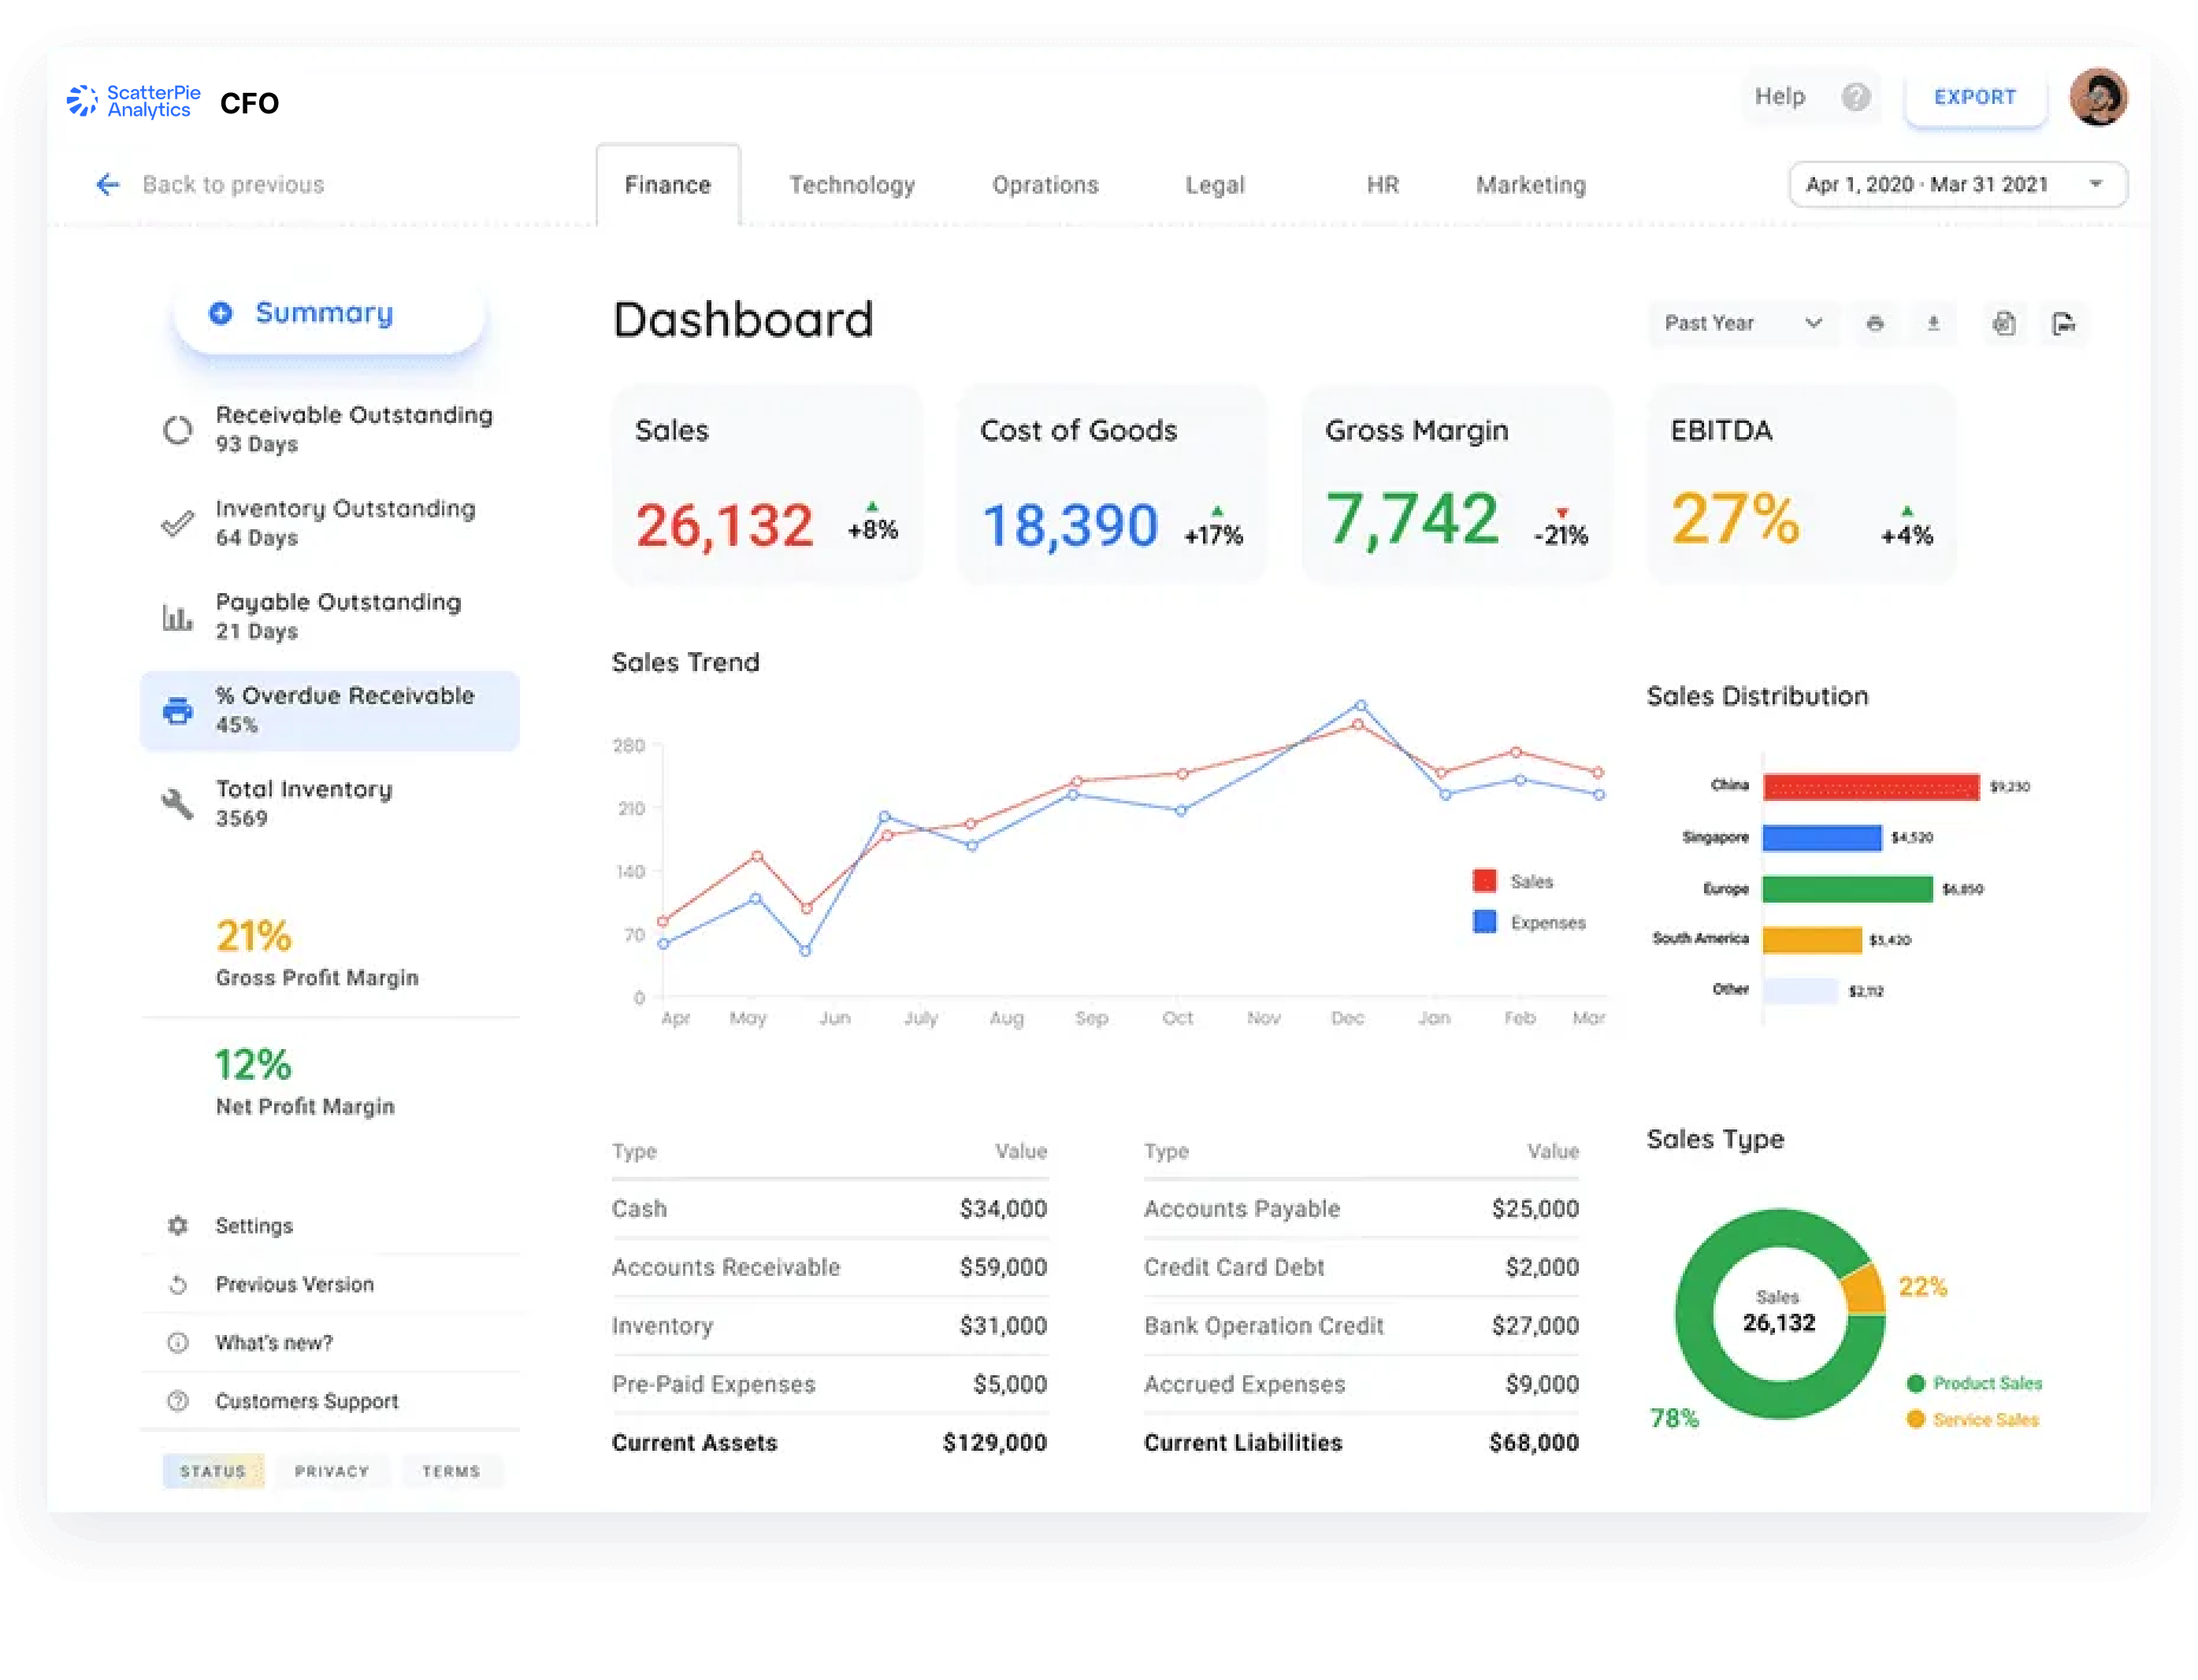
As an outcome, the ScatterPie team provided a series of Finance executive dashboards to the client which helped to organize their operations and monitor cash flows. The dashboards are aimed at simplifying various operational processes, with a key focus on tracking profits, costs, and margins.
More About Our Solution Provided
ScatterPie business analysts analyzed the existing excel to track captured data points and the list of KPIs. After the research, the analytics team defined which stats would be the most useful and which of them required to be shown in charts for better perception.
We designed and developed the dashboard in a way that users can see a high-level summary about
- Margins for the selected period
- Receivable outstanding
- Inventory Outstanding
- % of overdue payable
- Payable Outstanding
- Gross margins
- Cost of goods
- EBITDA
- Sales
The areas covered in the delivered solution were
Sales & Expense Trend
End users can analyze the revenue & expense trends for any costs incurred by the retailer and the number of goods sold
Sales Distribution
CFO can analyze the country-wise distribution of sales for targeting territory-wise business. Also, the further bifurcation of sales from services & products for different periods.
Profit & Loss Analysis
Capturing & analyzing MoM profit and loss from different portals. Understanding portal-wise, wholesaler-wise, product wise profit and loss analysis for different periods
Solution Benefits
ScatterPie’s solution resulted in the following benefits
- Simplified tracking of Finance KPIs for quick insights & informed decision-making
- Getting visibility in the day-to-day operations & financial data points
- Improvement in keeping track of sales, expenses, and assets/liabilities
- Timely emails to the CFO team with the most important KPIs to track
Click here to download the case study studies


