How ScatterPie Helped an IT Giant with ITSM Analytics to Improve the Performance of IT Service
Analyze Mean Time to Repair (MTTR), Mean Time Between Failures (MTBF), Service Level Agreement (SLA) compliance, and IT service availability to measure the IT service performance
Industry
IT & ITES
Business Functions
Information Technology Service Management
Solution Delivered
Data Analytics, Dashboard Designing & Development
Technologies
Figma, Power BI
Geography
Dubai, Abu Dhabi
About The Customer
By performing ITSM analytics, we helped the client gain a deeper understanding of the performance of their IT services and identify opportunities for improvement, which enabled them to provide better service to their customers and reduce costs.
This customer is one of the biggest IT service aggregators in East Asian countries. The client implemented ITSM to ensure that services are delivered efficiently and meet the needs of the customers. ITSM analytics was required to effectively manage and deliver IT services, which is essential for maintaining a competitive edge and meeting the demands of their customers.
 The Major Challenge Our Client Faced
Without ITSM analytics, the customer was facing several challenges, including:
- Difficulty in identifying and prioritizing opportunities for improvement
- Inability to measure the value of IT services
- Difficulty in identifying and resolving issues
- Difficulty in identifying trends and patterns
- Difficulty in making data-driven decisions
- Lack of visibility into service performance
The client wanted to gain visibility into service performance, measure the value of IT services, identify and resolve issues, make data-driven decisions, and ultimately improve the overall quality of IT services.
ScatterPie’s Primary Objective for This Project
The main objective of an ITSM analytics project is to use data and analytics to gain visibility into IT service performance, measure the value of IT services, and make data-driven decisions to improve the overall quality of IT services.
Some specific objectives of an ITSM analytics project include:
Identifying key performance indicators (KPIs) and metrics to measure service performance and customer satisfaction
Collecting and analyzing data from various IT systems and services to gain visibility into service performance and identify areas for improvement
- • Identifying trends, patterns, and root causes of service issues and outages
- • Measuring the value of IT services in terms of business outcomes and return on investment (ROI)
- • Supporting incident management and problem resolution
- • Improving service availability and continuity
- • Supporting service level agreement (SLA) management
- • Supporting capacity planning
- • Supporting IT operations and service management
- • Enhancing IT governance, compliance, and risk management
All in all, our ITSM analytics project aimed to provide visibility, insight, and intelligence to the organization’s IT service management and eventually improve service delivery, and overall performance of IT services, and drive better business outcomes.
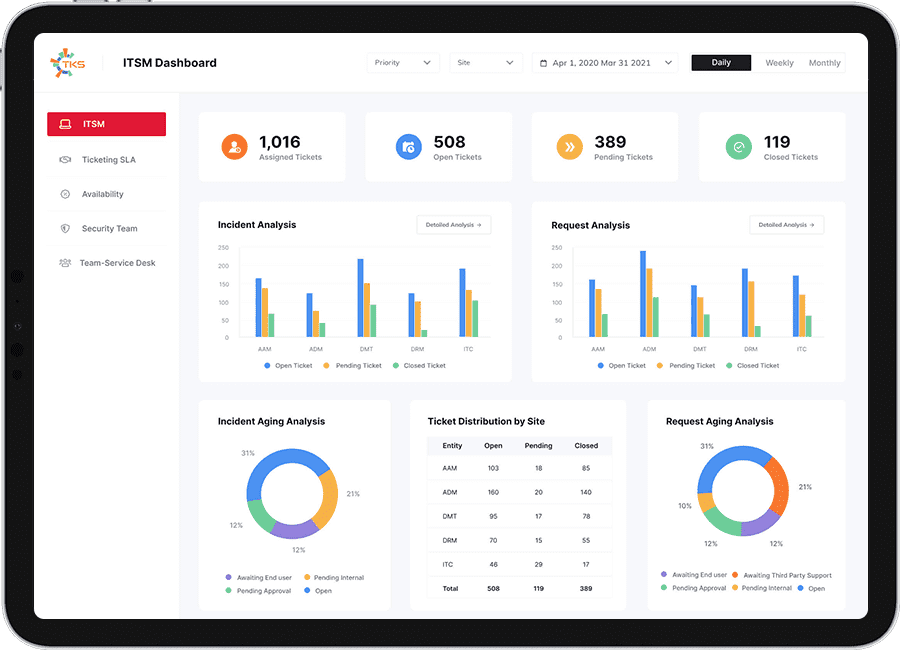
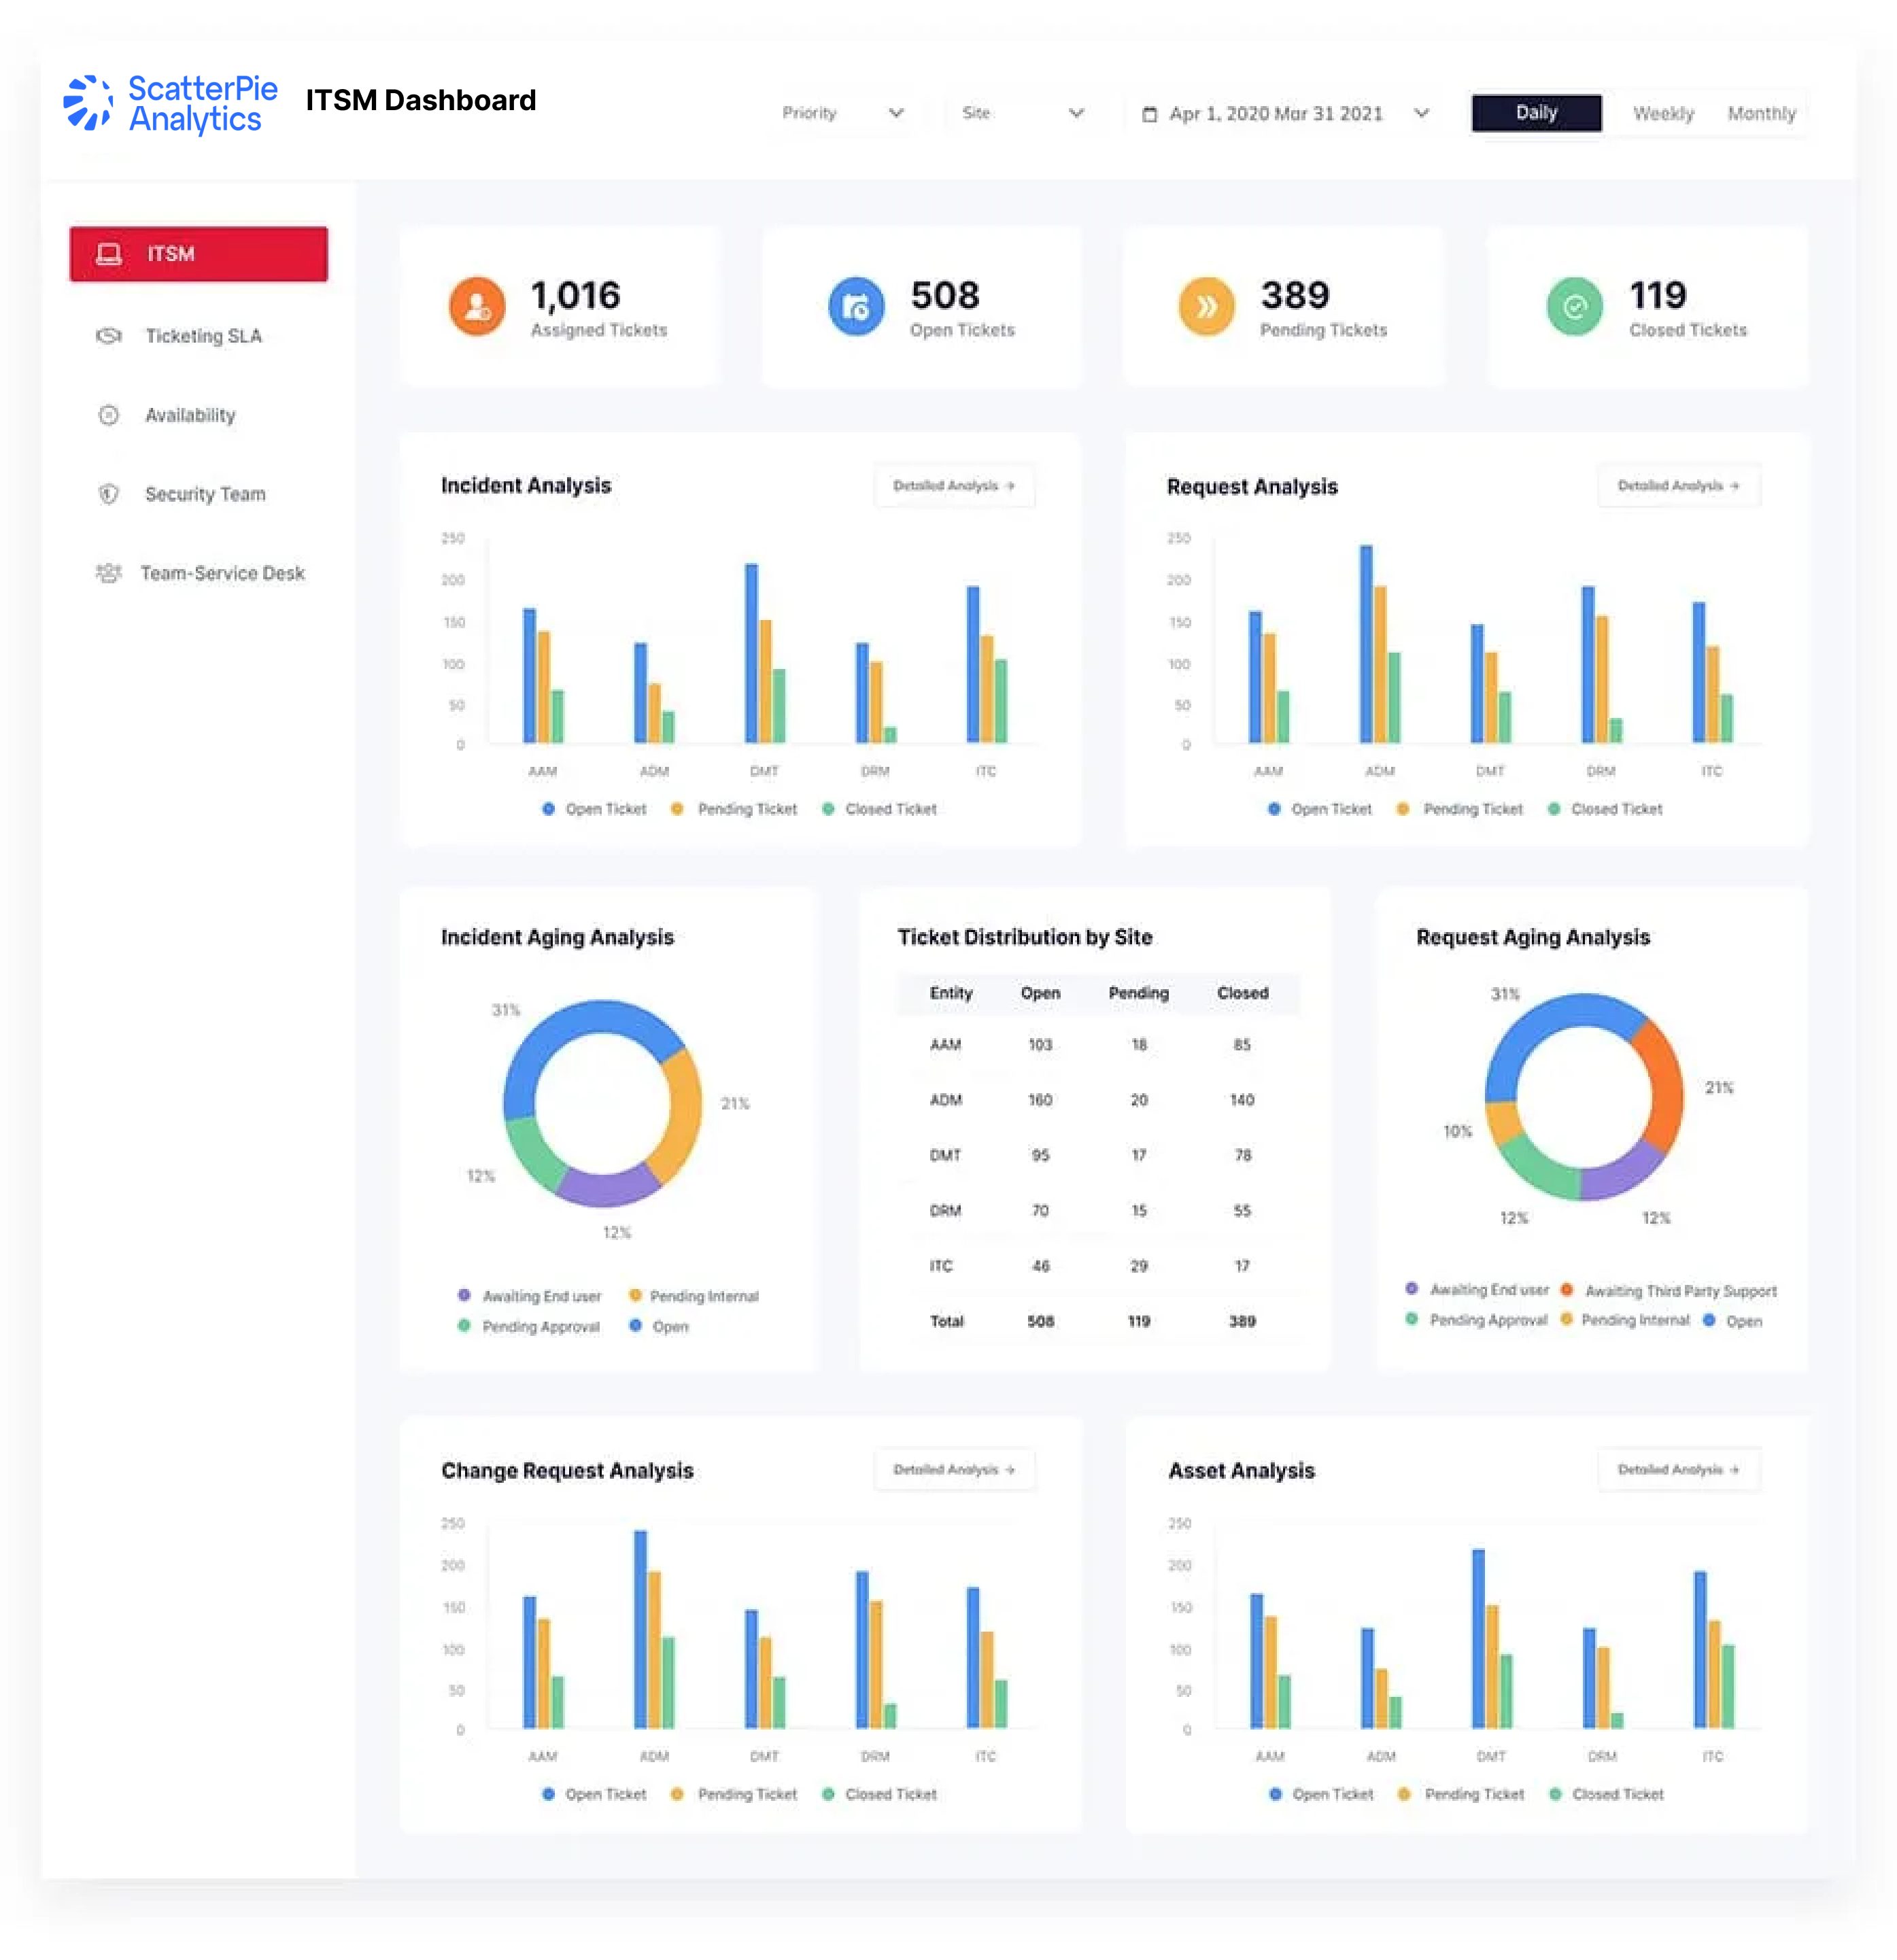
ScatterPie’s Solution — ITSM Analytics Dashboards
ScatterPie’s team used Power BI to connect to existing ITSM tools and prepared a list of extensive 50 dashboards for monitoring the business KPIs.
The areas covered in the delivered solution were as follows:
Mean Time to Repair (MTTR)
This KPI measures the average time it takes to repair a failed IT service. A shorter MTTR indicates that IT service disruptions are being resolved more quickly.
Mean Time Between Failures (MTBF)
This KPI measures the average time between failures of an IT service. A longer MTBF indicates that the IT service is more reliable.
Service Level Agreement (SLA) compliance
This KPI measures the percentage of IT service requests that are completed within the time frame agreed upon in the SLA. A high SLA compliance rate indicates that the IT service is meeting customer expectations.
Customer Satisfaction
This KPI measures the level of satisfaction of customers who use the IT service. A high customer satisfaction score indicates that the IT service is meeting customer needs and expectations.
IT Service Availability
This KPI measures the percentage of time that the IT service is available to users. A high availability rate indicates that the IT service is reliable and consistently available to users.
How Our Client Benefited Through Our Solution
ScatterPie’s solution resulted in amazing benefits as follows:
Improved Service Quality
By analyzing data on IT service performance, we helped the client identify problems and bottlenecks in the service delivery process and implement strategies to improve the quality and reliability of IT services.
Reduced Costs
By analyzing data on IT service usage and costs, the client was able to identify opportunities to optimize IT service delivery and reduce costs.
Increased Customer Satisfaction
By analyzing data on customer interactions and feedback, we helped the client to understand customer needs and preferences and implement strategies to improve customer satisfaction.
Improved Decision Making
By analyzing data on IT service performance and customer feedback, the client can now make more informed decisions about IT service delivery and investment.
Increased Efficiency
By analyzing data on IT service performance, the client was able to identify inefficiencies in the service delivery process and implement strategies to improve efficiency.
Enhanced Regulatory Compliance
Our solution helped the client meet regulatory compliance requirements.