Strengthening Insurance Claim Efficiency With Interactive Dashboards
Analyze Claim ticket frequency, current status, & their priorities for evaluating call center efficiency We helped one of our clients to see which tickets are open and their priority in order to make sure customers’ claims are being processed on time

Industry
Insurance
Business Functions
Call Centre, Business Operations
Solution Delivered
Data Analytics, Dashboard Development
Technologies
Tableau, Power BI
Geography
Singapore
About The Customer
This customer is one of the biggest Insurance companies in East Asian countries. For the insurance industry, prioritizing and accelerating digital transformation and data-driven efforts to improve operations, customer experiences, and risk management is the most important activity.
The current requirement of dashboards was to set up a mechanism to monitor regulatory compliance, insurance fraud, or managing audit processes, leveraging powerful analytics to make data-informed decisions

The Major Challenge Our Client Faced
Insurance has time-sensitive claims and having an open claim for long periods is not ideal for insurance companies, claims staff, and managers who are trying to hit targets, or the customers who want and need their claim to be handled.
The client wanted a data-driven system backed by data analytics to give visibility in call center efficiency in claim handling.
ScatterPie’s Primary Objective For This Project
The objective of this dashboard was to track the time-to-value of their analytics investments and evaluate call center efficiency to make sure customers’ claims are being processed on time.
How ScatterPie Fixed The Issue
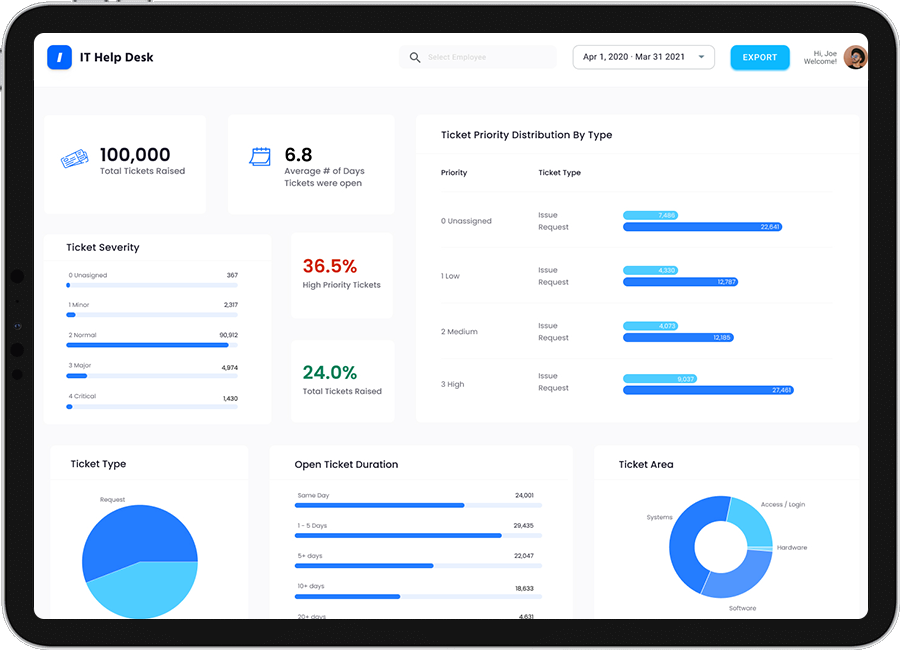
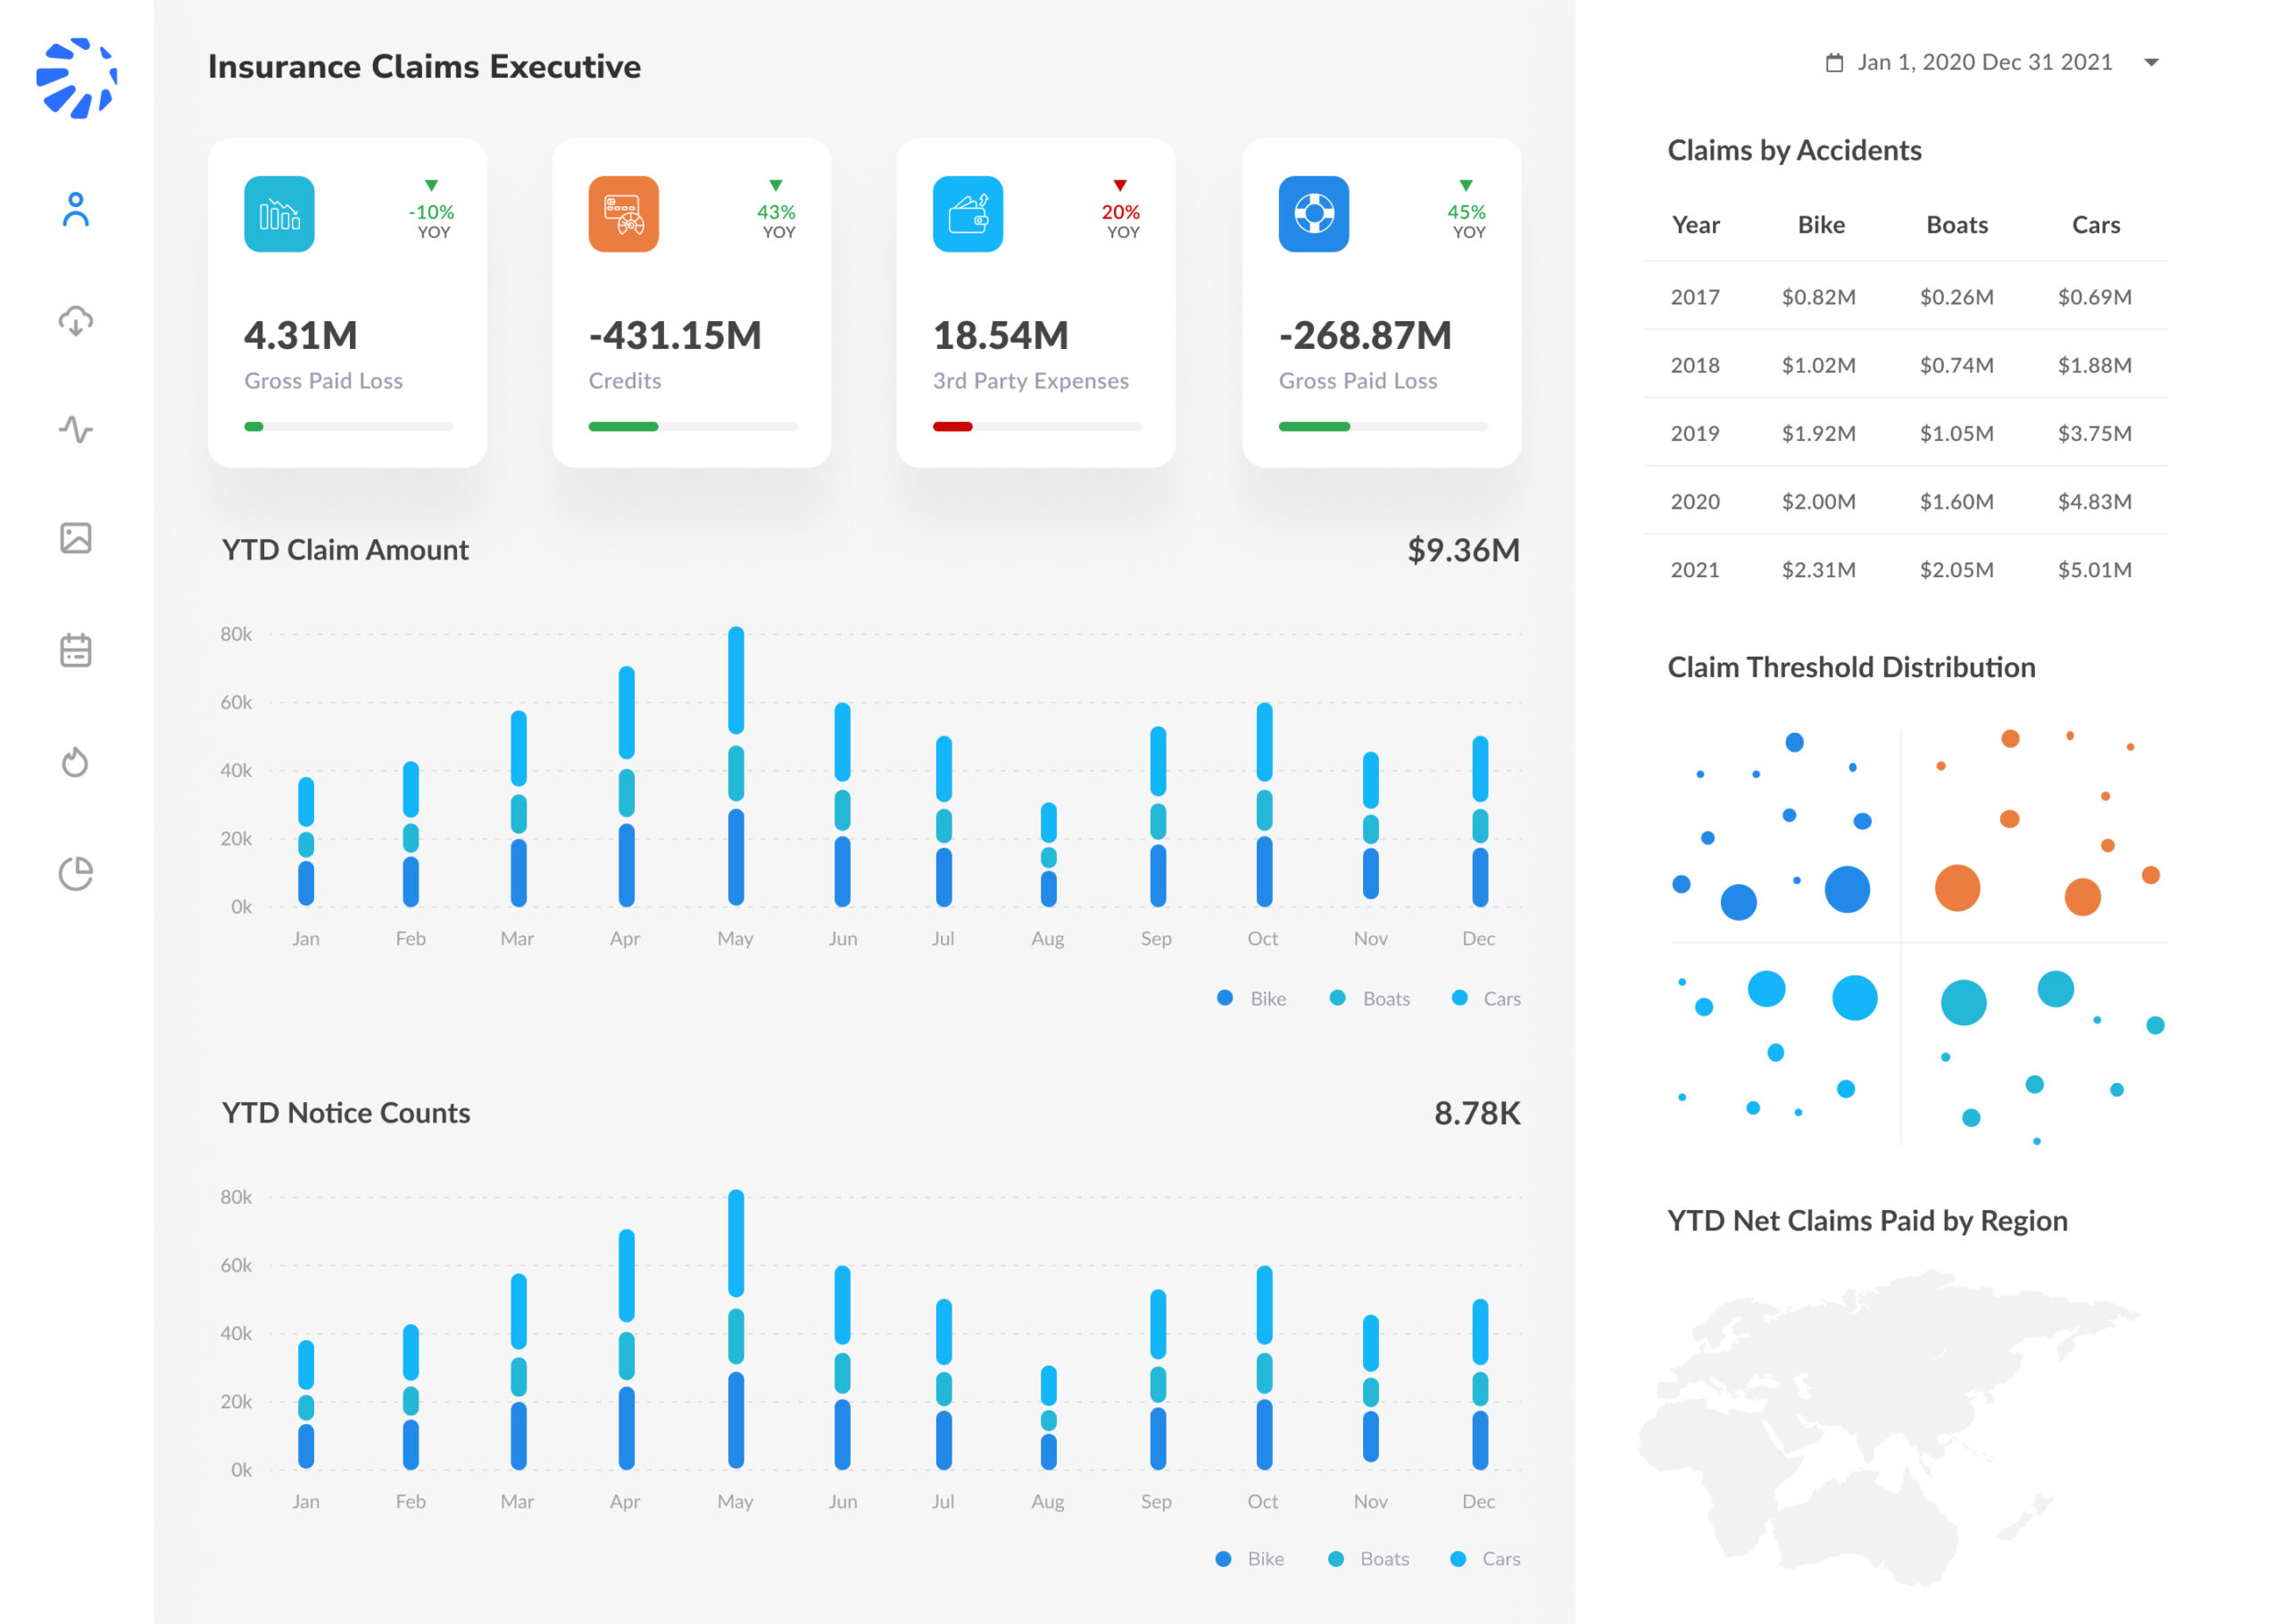
As an outcome, the ScatterPie team provided a call center level operations dashboard to quickly grasp average claim duration across different phases. For them, this is critical to reference to stay up-to-date on claims trends, claim pending duration, ticket priorities, and user satisfaction.
ScatterPie’s Solution — Claim Efficiency Analysis Dashboard
ScatterPie’s business analysts studied the existing decision-making from legacy systems, excel to track captured data points, and the list of KPIs. We suggested a dashboard for Managers to see track their call center day-to-day operations for Ticket distribution, priority & severity.
The dashboard users can see a total ticket raised, the average number of days the tickets were open, % of tickets resolved on the same day, and % of high priority tickets for the selected period
The areas covered in the delivered solution were
Requests Vs. Issues
For claims managers, this is critical to understand if the raised ticket is a request or issue raised by the client. Getting a deep dive into issues will give a detailed idea of possible challenges customers face in the process.
Ticket Priority
High-priority tickets should have minimum time to resolve. Getting visibility on Ticket priorities can help the operations team manage their activities accordingly.
User Satisfaction
User satisfaction for a call center is one of the primary KPIs to highlight. Being able to see user satisfaction can help managers learn details about why one person is satisfied with the service but the other is not.
How Our Client Benefitted Through Our Solution
ScatterPie’s solution resulted in amazing benefits. Our client was able to efficiently perform the following
- Track tickets with their priority & severity.
- Get visibility in the day-to-day operations & claims.
- Send timely emails to stakeholders with the most important KPIs to track.

